Data & Methods
FlowTracks simulates buoyant plastic fragments carried by ocean surface currents and visualizes projected marine plastic debris entering the ocean in 2025. The simulation combines country-level estimates of annual marine plastic debris with ocean current data to help users explore how plastic pollution may move, spread, and accumulate once it enters the marine environment.
Ocean plastic transport operates across two distinct spatial scales. Large-scale circulation patterns, such as gyres and boundary currents, operate at the scale of hundreds of kilometers, transporting debris across ocean basins over weeks to months. Smaller turbulent motions, including eddies and mixing processes, operate at the scale of hundreds of meters, redistributing particles through the surrounding water and driving lateral dispersion within a cloud of debris.
In FlowTracks, particle trajectories are computed by combining two physical processes. Large-scale advection is driven by the OSCAR surface current field, which moves each particle along observed ocean velocity vectors at each time step. Small-scale turbulence is approximated by the diffusion parameter, which adds an independent random displacement to each particle's position per frame, simulating the mixing effects of eddies and other sub-grid motions. Users can also control how many particles are released, how long each cloud persists, and whether current labels are displayed on the map. Together, these components allow users to observe how the interplay between large-scale transport and small-scale mixing shapes where plastic accumulates and how widely it disperses.
Ocean surface currents come from the OSCAR (Ocean Surface Current Analysis Real-time) dataset, in daily 1/3-degree velocity fields, pre-rendered as PNG files with u/v components encoded in the RG channels plus JSON metadata for efficient in-browser processing. Country-level marine debris projections for 2025 come from the Jambeck et al. (2015) dataset, loaded as a CSV with columns for coastal population, waste generation rates, plastic fraction, mismanagement percentage, and computed tonnes per year of plastic marine debris. Each country name is mapped to its Natural Earth equivalent using a lookup table.
The choropleth SVG overlay uses a Pacific-centered equirectangular projection rotated to [180, 0] to align with the OSCAR 0–360 longitude grid, filling the full 2:1 viewport. A hover tooltip displays each country's coastal population and estimated debris tonnage, with position clamped to viewport boundaries. The wind particle simulation is rendered using WebGL for GPU-accelerated performance, while the choropleth and country tooltip are built with D3.js.
To move the particles, each frame runs forward-Euler integration on a 720 x 360 bilinearly interpolated velocity grid. Particles wrap at longitude boundaries, clamp at latitude boundaries, and freeze on land. On mouse click, a cloud of particles (default 50, adjustable 1–50) is released with a Gaussian spread. The path history of each particle is stored for trail rendering, and residence density is accumulated onto a 360 x 180 heatmap grid that is rendered as a log-scaled dark-to-bright green overlay (cells below 3 hits are transparent). Cloud lifetime is computed from the user's day setting, and the spread metric (RMS distance from centroid over ocean-resident particles) drives the Particle Spread Over Time plot.
The small-scale turbulence is modeled as an isotropic Gaussian random walk; that is, per frame, each particle receives an independent random displacement. The diffusion parameter defaults to 0.001 and is user-adjustable via a slider from 0 to 0.001. Each particle's noise is independent, and the magnitude scales linearly with the slider value.
The simulation prioritizes real-time browser performance while maintaining physical plausibility. Forward-Euler integration with bilinear velocity interpolation provides a computationally efficient approximation of particle advection, and the isotropic Gaussian random walk captures diffusive sub-grid effects without requiring a full turbulence model.
Design Approach
FlowTracks was designed to guide users through a progressive experience, moving from emotional hook to scientific exploration. The loading page opens with a single striking statistic, a one-line context sentence, and a direct personal question, inviting users into the problem before any interaction begins. The About page then introduces the environmental stakes using accessible language grounded in scientific concepts, before the simulation itself hands control to the user. This sequencing was intentional: understanding why ocean plastic is difficult to track makes the act of releasing and watching particles feel meaningful rather than abstract.
The visual language was built around two accent colors that carry consistent meaning throughout the interface. Toxic green represents pollution, used for particle trails, choropleth intensity, highlighted statistics, and the Reset button. Teal represents information and interaction, used for navigation, current labels, control highlights, and explanatory text. Together these sit against a deep ocean gradient that moves from lighter blue at the top to near-black at the bottom, creating a sense of depth and unease. Typography uses Cormorant SC and Cormorant serif throughout, chosen for their editorial quality and subtle tension between beauty and gravity.
Interactivity was designed to build intuition rather than simply display data. Hovering over ocean current labels reveals their names; hovering over countries surfaces their projected plastic contribution; hovering over controls explains what each parameter does. The particle spread plot lets users compare multiple releases and observe directly how turbulence and release location shape dispersal patterns. Every design choice, from the constrained particle animation in the margins to the choropleth's dark-to-bright green scale, was made to help users feel, not just read, how their own actions and the ocean's dynamics together determine where plastic goes.
References
Jambeck, J. R., Geyer, R., Wilcox, C., Siegler, T. R., Perryman, M., Andrady, A., Narayan, R., & Law, K. L. (2015). Plastic waste inputs from land into the ocean. Science, 347(6223), 768–771. https://doi.org/10.1126/science.1260352
van Sebille, E., Wilcox, C., Lebreton, L., Maximenko, N., Hardesty, B. D., van Franeker, J. A., Eriksen, M., Siegel, D., Galgani, F., & Law, K. L. (2015). A global inventory of small floating plastic debris. Environmental Research Letters, 10(12), 124006. https://doi.org/10.1088/1748-9326/10/12/124006
DiBenedetto, M. H. (2025). The fluid mechanics of ocean microplastics. Annual Review of Fluid Mechanics. https://doi.org/10.1146/annurev-fluid-120423-012604
United Nations Environment Programme. Plastic pollution. https://www.unep.org/plastic-pollution
OSCAR ocean surface currents: Ocean Surface Current Analyses Real-time, produced by Earth & Space Research from satellite sea surface height, wind, and temperature data. Distributed by NASA PO.DAAC. https://doi.org/10.5067/OSCAR-25F20
Land shaded relief: Esri World Shaded Relief, derived from SRTM elevation data. Sources include Esri, HERE, Garmin, USGS, and the GIS User Community.
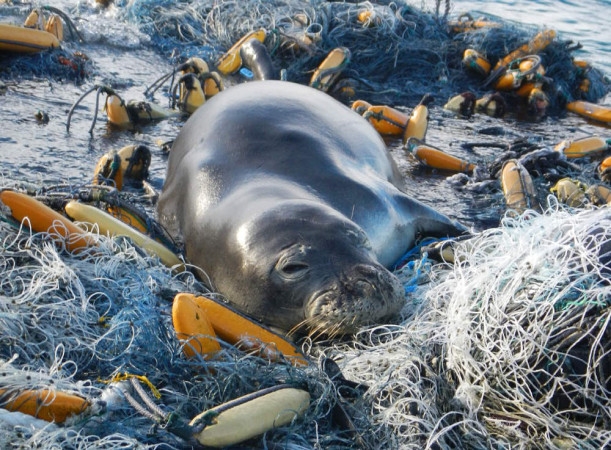
Monk seal resting on marine debris. NOAA Marine Debris Program. Public domain. https://marinedebris.noaa.gov
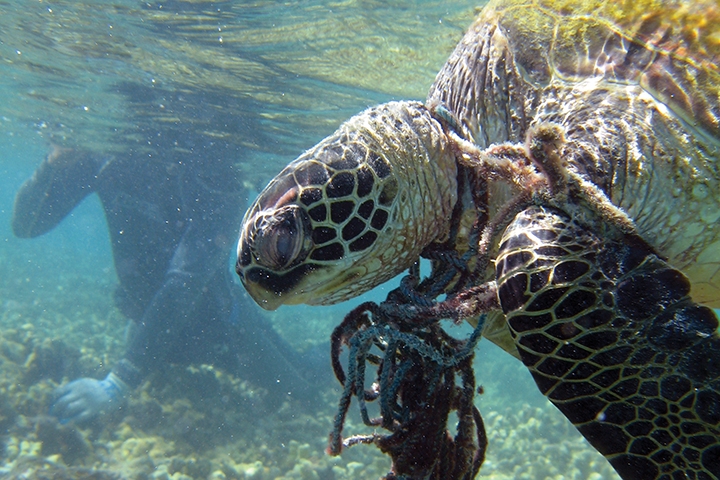
Hawksbill sea turtle entangled in fishing net. NOAA. Public domain. https://marinedebris.noaa.gov